Graphic analysis of sales, expenses, clicks…
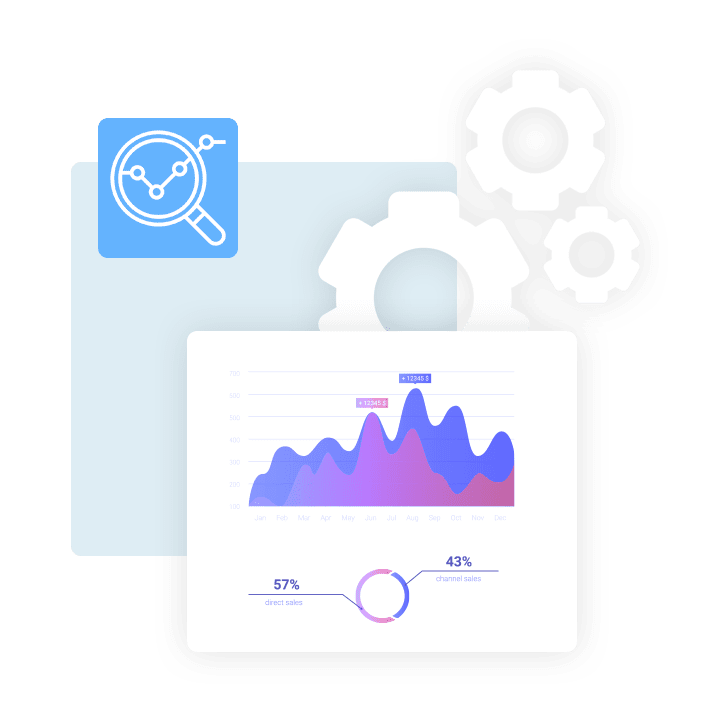
Graphs give you a great visual overview of your business!
Nifty Stats offers several graph types which will immediately paint the picture about your products and tell you which sell well and which do not, how much your total sales are, how many impressions, rebills or chargebacks you’ve had, and all this over any period of time and with any frequency you like. The graphs in Nifty Stats also allow you to compare your trading positions with various affiliate programs and advertising networks. The same goes for expenditures – you can immediately see where and how much you spend. Graphs can even show you histories over several years!


 PC
PC
 Mac
Mac
 PC
PC
 PC
PC
 PC
PC
 Mac
Mac
 PC
PC
 PC
PC
 Mac
Mac
 PC
PC
 Mac
Mac
 PC
PC
 Mac
Mac
 PC
PC
 Mac
Mac
 PC
PC
 Mac
Mac
 PC
PC
 PC
PC
 PC
PC
 PC
PC
 Mac
Mac
 PC
PC
 PC
PC
 PC
PC
 PC
PC
 PC
PC
 Mac
Mac
 PC
PC
 Mac
Mac
 PC
PC
 Mac
Mac
 PC
PC
 Mac
Mac
 PC
PC
 Mac
Mac
 PC
PC
 Mac
Mac
 PC
PC
 PC
PC
 Mac
Mac
 PC
PC
 Mac
Mac
 PC
PC
 Mac
Mac
 PC
PC
 Mac
Mac
 PC
PC
 Mac
Mac
 PC
PC
 Mac
Mac